Art and Democracy
In partnership with the Johnson Museum of Art, the Center for Global Democracy at Cornell University facilitated the creation of a democracy-learning art exhibit to help prompt new thinking and discussion on political events and processes. Across ten learning sessions, 45 Cornell students participated in viewing, learning about, and discussing the pieces. The exhibit featured topics from political revolutions around the world, political leaders, civil rights, reflection on identity in America, the roles of nationalism and patriotism, as well as authoritarianism and violence.
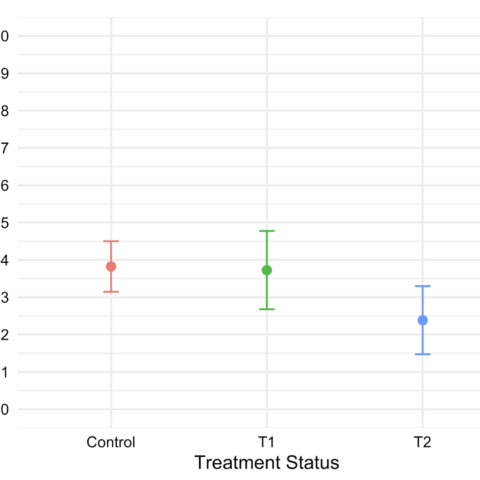
We studied the effect of the learning experience through a short questionnaire given to one group before the discussion and our second set of participants after the discussion. For a comparative baseline, we create an online sample of university students and apply a matching technique to produce a similar sample of students.
Our findings confirm, even through this small sample, that attending the session and viewing the democracy-related art strengthens support of and commitment to democracy, particularly the rule of law and the need for political opposition.
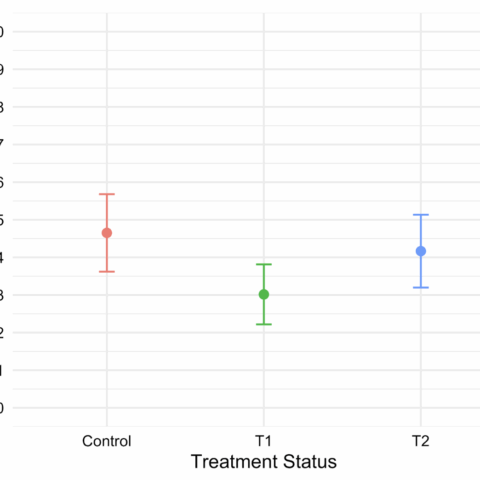
We also observe a significant difference between those measured after only viewing the art and those who viewed and then discussed the pieces. In the latter group, we find average lower degrees of negative partisanship, in particular, students being less sympathetic to the view that rival partisans are a threat to the country.